Welcome to Codidact Meta!
Codidact Meta is the meta-discussion site for the Codidact community network and the Codidact software. Whether you have bug reports or feature requests, support questions or rule discussions that touch the whole network – this is the site for you.
Post History
On the EE site, Moderator Tools > Reports > Users yields the following graph: This can't be right, because it shows users joining before 7 June, the day the site was launched. It's also not...
#2: Post edited
by
 ArtOfCode
·
2020-07-25T21:28:19Z (almost 5 years ago)
ArtOfCode
·
2020-07-25T21:28:19Z (almost 5 years ago)
#1: Initial revision
by
 Olin Lathrop
·
2020-07-25T21:24:04Z (almost 5 years ago)
Olin Lathrop
·
2020-07-25T21:24:04Z (almost 5 years ago)
Subscriptions graph doesn't make sense
On the EE site, Moderator Tools > Reports > Users yields the following graph: 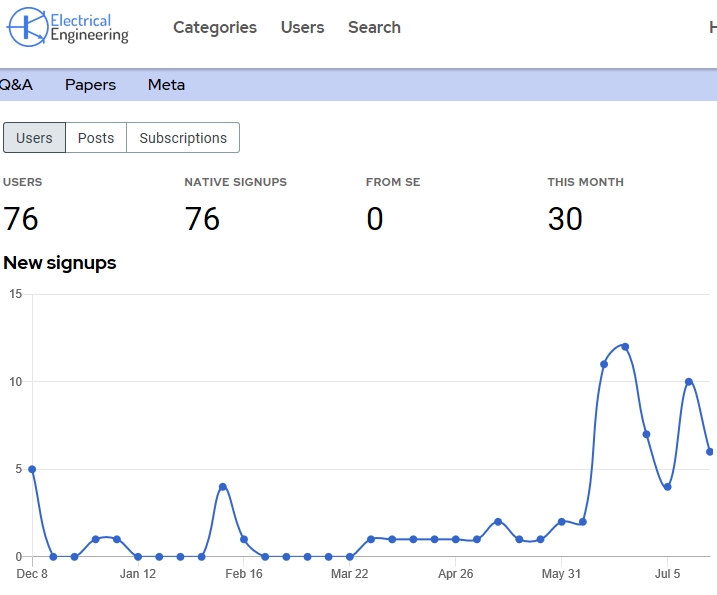 This can't be right, because it shows users joining before 7 June, the day the site was launched. It's also not clear what the real Y axis units are, since absolute numbers of signups is meaningless without a time interval, like signups/fortnight or something. These are low priority issues since this graph isn't critical for anything. I noticed it, so I'm mentioning it just to get it on a list to address eventually.