Welcome to Codidact Meta!
Codidact Meta is the meta-discussion site for the Codidact community network and the Codidact software. Whether you have bug reports or feature requests, support questions or rule discussions that touch the whole network – this is the site for you.
Diagram errors in "Scoring" help article
The help page explaining the post scoring method has some diagrams at the end, but they are somewhat confusing.
Axis mislabelling
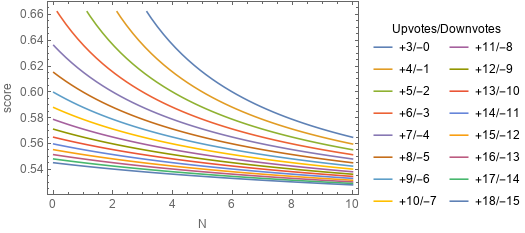
The following chart has a horizontal axis labelled "N", which is confusing as there is no other mention of "N" on the page. Should this say "z"?

Diagrams in a different order to the descriptions
The description below each diagram is confusing:
- The first diagram does not have a description, making it unclear whether the description below the second diagram refers to only the second or to both.
- The second diagram has a description that looks like it is probably correct, but is confusing due to mentioning "z", where the diagram (probably incorrectly) shows "N".
- The third diagram has a description saying "This table" when it is a 3 dimensional plot of a surface. It looks like this description might belong with the first image.
Since the third image appears to be a 3 dimensional visualisation of the data in the table in the first image (over a slightly larger domain: 1-15 votes rather than 1-10), it might be easier to understand if those two images were adjacent, rather than being separated by the less related second image that varies z.


0 comment threads